


Respiratory virus hotspots.
What the heck is happening in Arizona?

Respiratory virus season is ramping up. Last week, we covered the uptick in influenza hospitalizations in older people coming out of the Thanksgiving holiday and thereafter. As expected, those rates went up again this week.
We’re also starting to see Covid-19 wastewater levels increase, as we’ve come to expect at this time of year. So far, though, the levels are lower than previous winters. This is likely an aftereffect of late summer surges in many places around the country. As a result of the millions of infections during the summer and early fall, there are currently fewer people at their maximum susceptibility to Covid than is typical for this time of year—especially since a well-adapted new variant has not burst onto the scene, which lowers the threshold for infections among people with prior immunity to previous variants. However, with each passing day, antibodies (from those infections and from fall vaccinations) are declining, leaving more people at increased risk of a new infection.
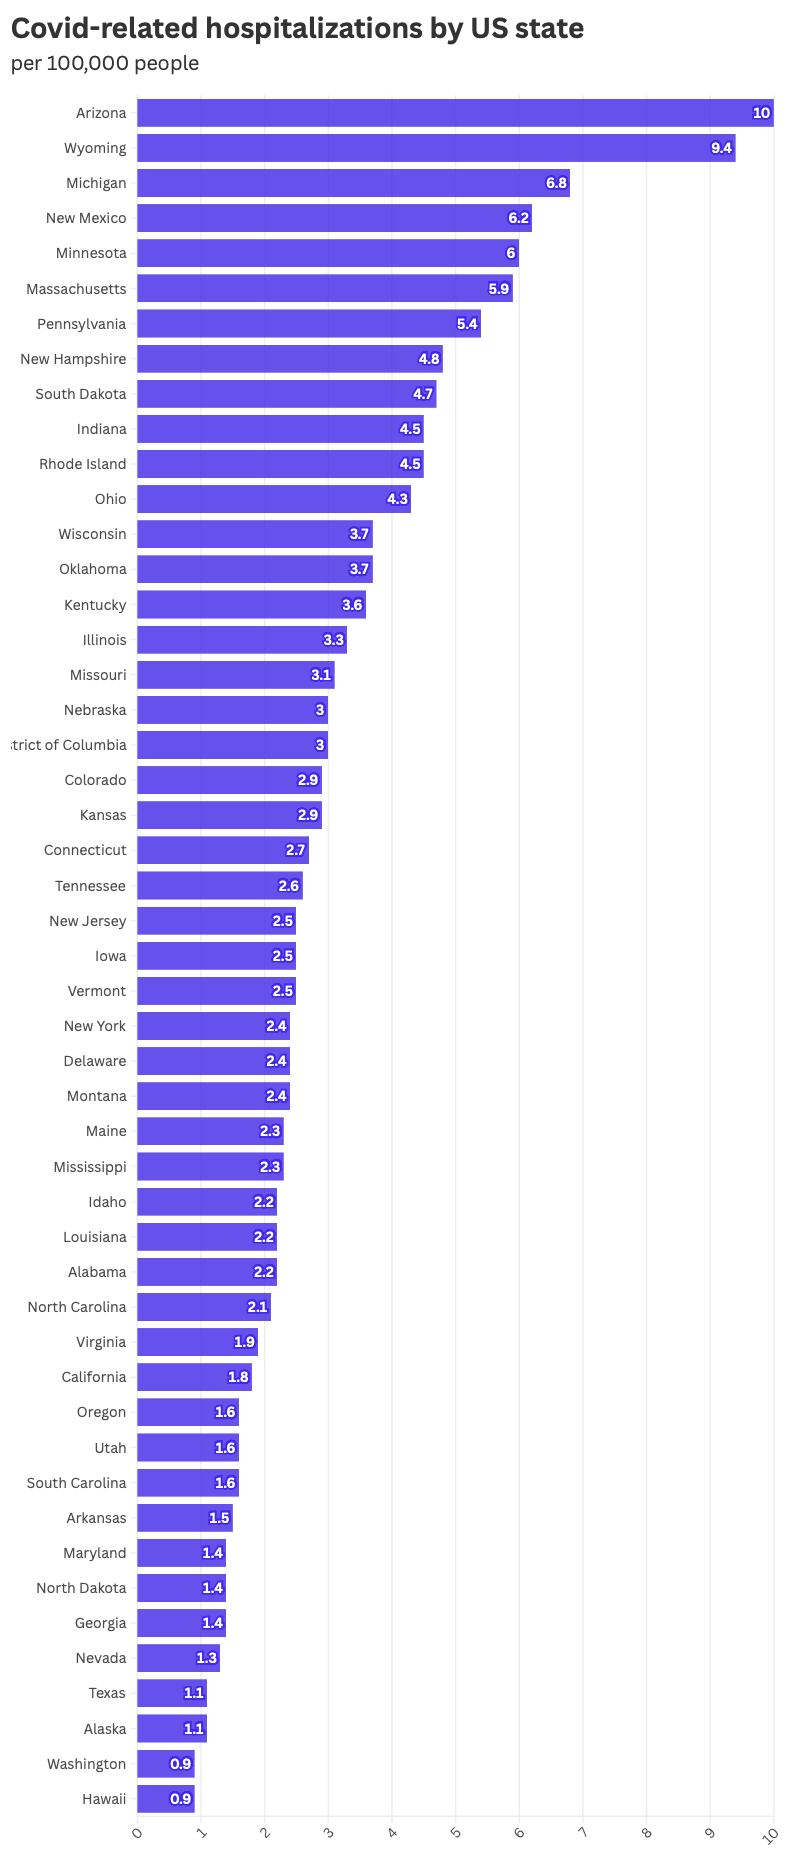
That said, some states are getting hit much harder than others. In particular, there’s a pocket in the Southwest (Arizona and New Mexico) that looks like a hotspot. Arizona’s Covid-related hospitalization rate hasn’t been this high in two years (since the 2022-2023 peak), though its wastewater levels are comparatively milder than last year’s winter peak levels. Meanwhile, New Mexico’s wastewater levels are much higher than they were during its peak last year.
Here's the data for the week ending December 20th.
Of course, Covid-19 is not the only virus in town. While in the past, Covid hospitalizations were both more common than flu and RSV hospitalizations, they were also far more dangerous on a per-case basis. In the early days of the pandemic, a Covid-related hospitalization was 500% more likely to be deadly than a flu-related hospitalization. Research shows that by last winter, the gulf between those two pathogens had narrowed markedly. While Covid was still deadlier than flu on a per-case basis last season, the gap had fallen to just 35%.
At the moment, we can’t know for certain which among Covid, flu, or RSV is the most likely to cause or contribute to a hospitalization. But what we can say is that nearly five years into the Covid-19 pandemic, the differences in severity across the “big three” respiratory pathogens have narrowed. In fact, for people who still want to mask when there are higher levels of pathogens that are potentially dangerous to high-risk people, it’s starting to make sense to think beyond just Covid numbers.
I haven’t seen anyone combine Covid, influenza, and RSV-associated hospitalizations into one metric before. It wasn’t even possible until recently, when the federal government started requiring all states to report data on all three viruses every week. So, Inside Medicine data guru Benjy Renton and I went ahead and combined these data points into one metric: Combined respiratory virus-related hospitalizations (Covid, flu, and RSV), by US state, per 100,000 people in the population.
Here are the state-by-state levels as of December 20th.

And here is how the combined rates compare to those of last year (which is as far back as we can go right now). Again, you can see that Arizona seems to be in a class by itself right now, though the reasons for this are not clear to me, though I have some hypotheses. (Please join the conversation!)

If you want to explore the data for your state, here are links to three of our active dashboards, including an interactive version of this last graph:
Combined Covid, flu, and RSV-associated hospitalizations by state.
Inside Medicine Covid and Respiratory Illness Dashboard (wastewater, hospitalizations, and more).
Feedback? Questions? Please join the conversation in the Comments section.
Thanks to Benjy Renton for curating the data behind the dashboards you see here.
vaccine rate in Arizona? I'd love to see a comparison of RSV/flu/covid vax rate and illness in Arizona.
Might seasonal returning snowbirds explain some of the Arizona number? Very interesting!