


In 1913, epidemiologists made a bold prediction about death disparities. They were wrong.

Back in 1913, the US Census Bureau was busy counting as many births and deaths as possible. The annual reports were herculean efforts.
As part of my research on population mortality, I occasionally find my way into some old document. Something in an article in the Journal of the American Medical Association published in 1914 caught my eye today.
The epidemiologists observed that death rates had fallen since 1900. Had they not, they noted, 134,623 more deaths would have occurred in 1913 than actually did. This is not unlike Dr. Alyssa Bilinski’s recent analysis (also in JAMA) of deaths we could have averted had vaccination rates been higher during the Delta and Omicron waves of Covid-19.
Something else caught the eye of our predecessors: racial disparities.

The authors wrote that the differences in death rates between White and non-White people were “startling,” but appeared to be narrowing. The epidemiologists were hopeful, though. They boldly predicted that within a decade, the mortality gap between White and non-White people would narrow, if not disappear.
“Another decade should see a more reasonable balance between the rates accorded to the two races,” they predicted.

Indeed, our epidemiology predecessors were correct to identify that the differences were not reasonable and should not stand.
For this, we appreciate them.
On the other hand, we won’t give them a free pass either, as nary a paragraph separated this relatively progressive sentiment from one which more-or-less blamed non-White people themselves for this problem, vis-à-vis personal hygiene. Cringe.
How did their prediction pan out? Not well. By 1923, death rates had again fallen for everyone (with 1918’s influenza pandemic being the massive exception). But the racial gap in mortality had not gone away as predicted. Here’s the raw data:
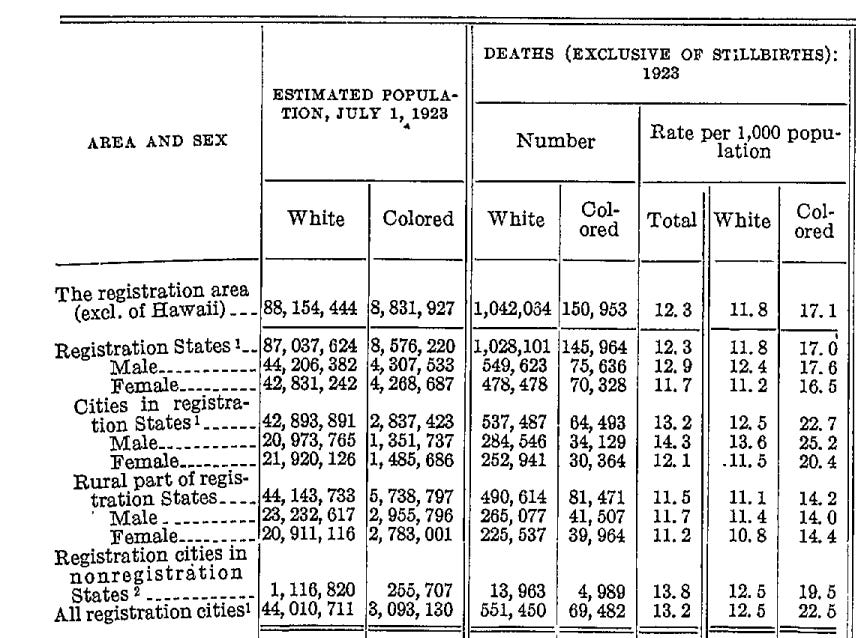
A little number crunching and here’s what you get. In 1923, non-White people made up 9.1% of the US population (for which they had data), but made up 12.7% of the mortality. By my calculations (using relative risk), that means that non-White people had a 45% higher chance of dying each year compared to White people. In cities, things were worse, with non-White people having a 81% higher chance of death compared with White people. Rural areas had the least racial disparity, with non-White people having a 28% higher chance of death compared with White people.
What explains those differences? Systemic racism and other structural inequities (like poverty) are the lead suspects, especially given the overall trends and the differences we see along rural and urban lines. But I am interested in exactly how those forces played out. Was it the water and food supply? Was it access to medical care (such as it was)? Was it unsafe environmental exposures?
I’ve reached out to a couple of experts to see what they think. Hopefully, I’ll get some views on this and share them with you.
This next section is for anyone who wants to geek out to the epidemiology of the early 20th century and learn a little bit about our nation’s fascinating history of record keeping, which was blossoming at that time. So for anyone interested in a charming little digression into our rich history of meticulous mortality data gathering and analysis…please join me!
Keep reading with a 7-day free trial
Subscribe to Inside Medicine to keep reading this post and get 7 days of free access to the full post archives.