


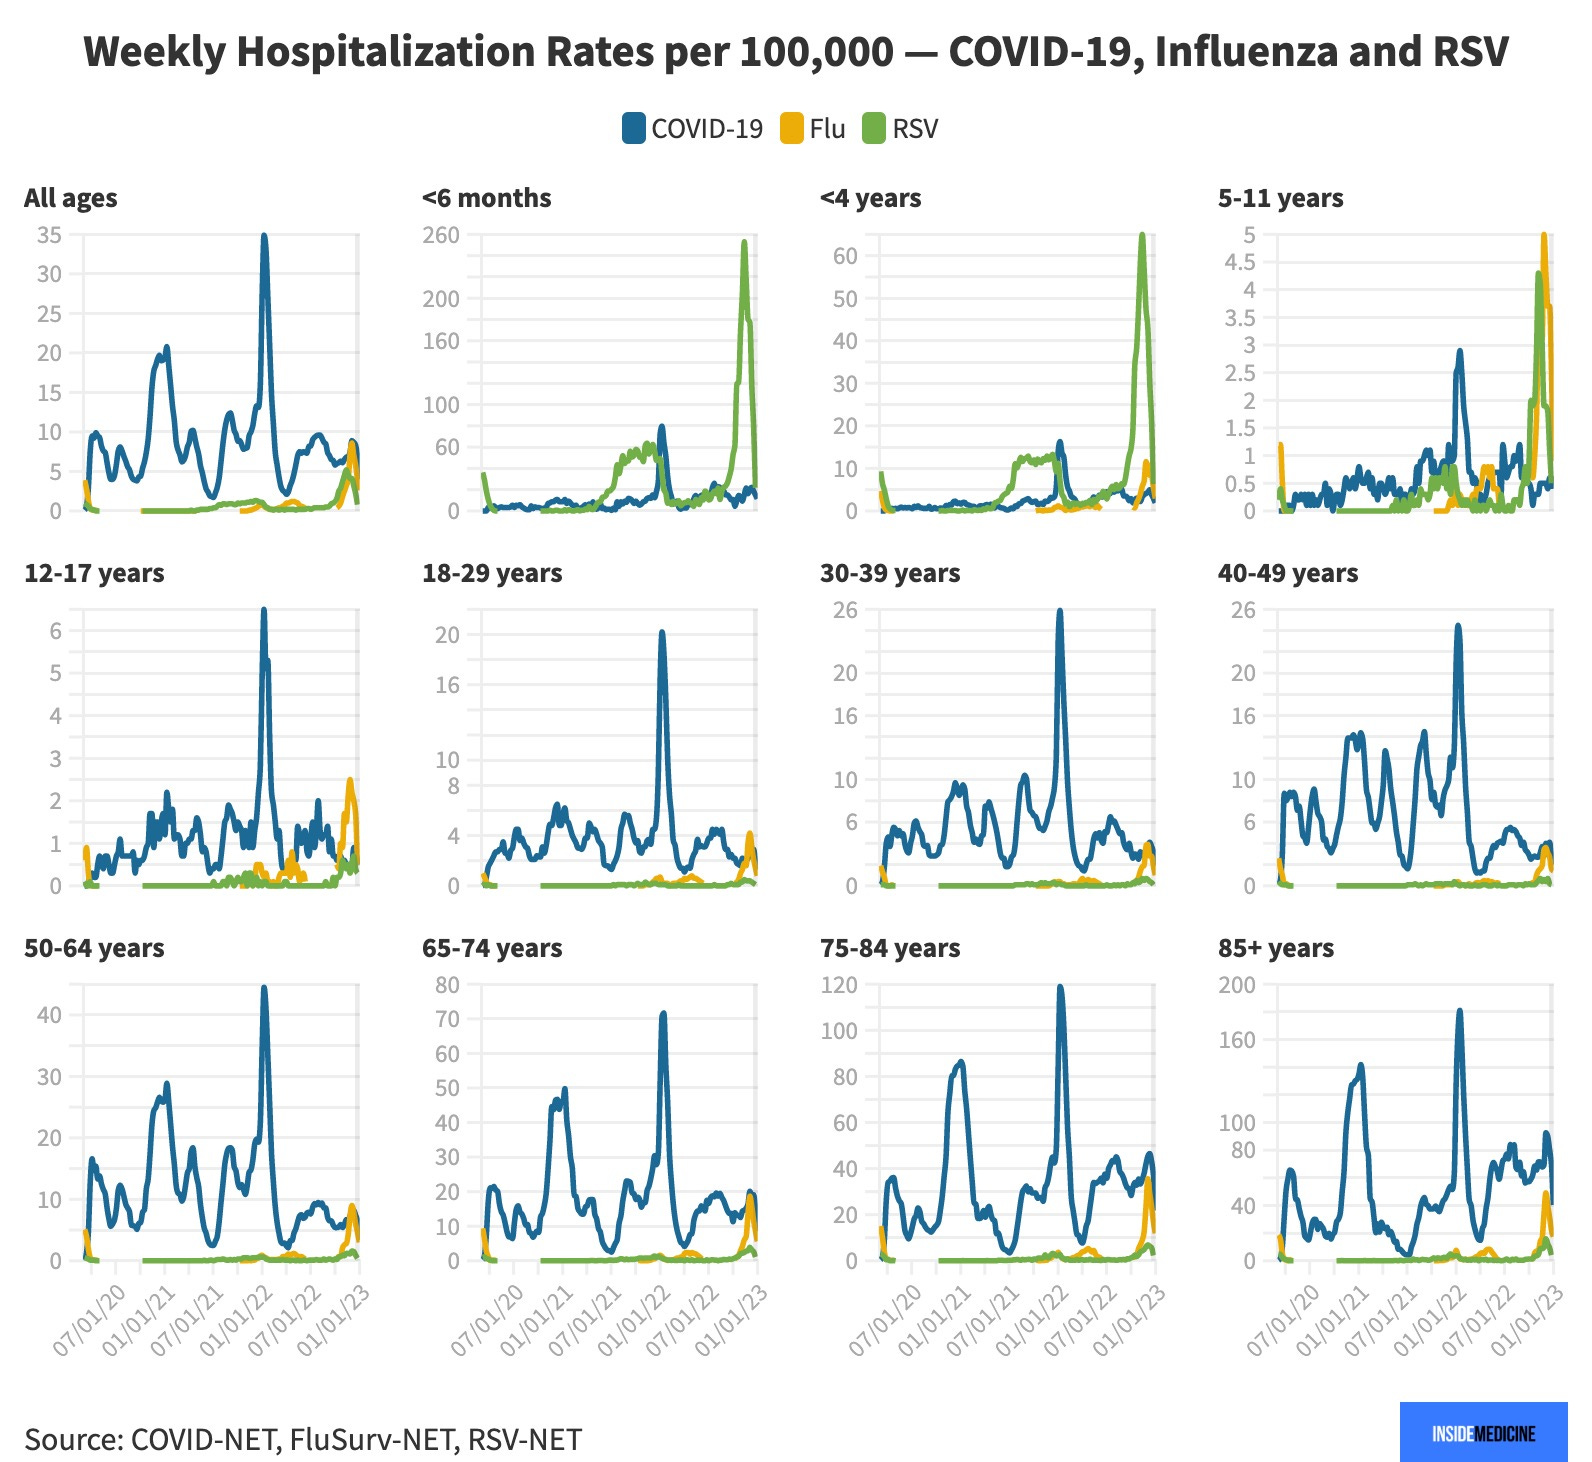
Data Snapshot: Covid-19, flu, and RSV hospitalizations on a single graph.


Much has been said about the “tripledemic” of Covid-19, influenza, and RSV. But I’ve never seen a head-to-head visual comparison of hospitalization rates of these pathogens at a time when all three were circulating widely. So, Inside Medicine’s Benjy Renton and I spent the evening pulling data and throwing them onto the same graphs. In addition to grabbing data on the entire US population (see above), we also looked by age group (see below). This all yielded some important insights, which I’ll share with you now.
The biggest takeaway is that for late November and much of December—and for the first time since the Covid-19 pandemic began—flu and RSV often combined for higher rates of hospitalization than Covid-19 (Note: the shaded grey regions indicate that there are likely lags and that the apparent drop-offs in the last couple of weeks may not actually be so drastic).
Further comments:
While flu and RSV combined for higher rates of associated hospitalizations than Covid-19 in the last few weeks, Covid-19 is still hospitalizing the most people of any of these three diseases. The good news is that Covid-19-associated hospitalizations are nowhere near the levels seen during the last two winters. This likely reflects a population that is overall more immune to the worst consequences of Covid-19, but we’ll see if this holds.
Influenza-associated hospitalizations do not normally peak in December (although it can happen). Things normally peak in January, February, or even as late as March. We’re watching to see if the November-December wave was “it” or whether we’re in for more as the season progresses.
The influenza hospitalization rates seen at the peak in December was not unusual in terms of its magnitude for all ages combined, but was unusual in its timing. (Again, in most flu seasons, the peak comes later).
However, the rate of influenza hospitalization was unusually high for children. For example, in children ages 0-4 years, over 11 children per 100,000 had a flu-associated hospitalization in late November. That was the worst single week since weekly reporting on FluSurv-NET began back in 2009 (the previous worst was indeed during the peak of the 2009 H1N1 outbreak). Usually, hospitalization rates peak between 4-6 per 100,000 children in milder years and 7-9 per 100,000 children in worse years.
Let’s take a closer look at various age groupings we have access to (below).
Comments:
It’s obvious that RSV is hospitalizing a ton of very young children (ages 0-6 months and ages 0-4 years) in comparison to typical flu rates (for ages 0-4; we don’t have flu data for 0-6 months) and Covid-19. While we only have RSV hospitalization data going back to 2018, the rates we saw in late fall of 2022 were unlike anything we’ve seen before. A lot of this is likely “catch-up” from the past couple of years; that is, kids did not get RSV (because of Covid-19 mitigation measures), and now there’s a kind of backlog so that kids who normally would have gotten the virus over 2 or 3 seasons got it all at once. (I’ve been meaning to write about that, and will soon.) That said, many RSV-associated hospitalizations for the 0-6 month aged infants are for “apnea checks.” That is, often, the babies are basically fine, but their airways are so small, that they need to be under constant medical supervision so that if they stop breathing (apnea), teams can immediately intervene. We do not yet know whether there will be increased mortality from this wave of RSV hospitalizations. However, speaking to colleagues who work in pediatric ICUs, the general sense I have is that children hospitalized for Covid (and flu for that matter), tended to be much sicker and in more danger than those hospitalized for RSV. Mortality data are trickling in, and those numbers will confirm or refute those impressions in the coming weeks.
RSV and flu for school-aged kids (ages 5-11 years) are now eclipsing the Covid-19 peaks seen during the initial Omicron outbreak a year ago. In this age group, Covid-19-associated hospitalizations peaked at rates that exceeded many but not all flu years. What we are seeing for flu now is unprecedented since data collection began, other than during the peak of 2009 H1N1. This might also reflect a catch-up phenomenon (or perhaps increased testing), but it’s certainly an argument for vaccinating kids for flu. Recent RSV rates also tower over prior years. That said, the rates of hospitalization for all three pathogens in children ages 5-11 years is a small fraction of the rates seen in children ages 0-4 years.
For young, middle-aged adults, and seniors up to age 84 years of age, flu and Covid are now associated with similar rates of hospitalization (i.e., during the last few weeks). (Covid-related hospitalizations remain well above flu for seniors ages 85 and up.) Compared to prior peaks for seniors, the flu hospitalization peak in early December was not particularly high. But again, the timing of that early December peak (in this age group) was alarming. If things fizzle out, this won’t have been a bad flu season for seniors after all. But if November and December were mere preludes, then we’re in trouble.
Thanks to Benjy Renton for curating Data Snapshot.
I think these data you have presented are mostly encouraging, except for the very young and very old as they are buffetted by these distinct but overlapping waves. Kind of like how rogue waves result from the summation of individual ones, this winter in primary care has felt more than choppy.
Although people are struggling with nasty illnesses, and I'm seeing a lot of protracted syndromes/long Covid, these data confirm what I have to admit - I'm not sending nearly as many people your way (ER) as compared to recent years. But the collateral damage of bloot clots and cardiac events keeps anecdotally happening more than I think it should.
Also as side note, my next door neighbor and good friend in Philly (J. Strauss) shares an appreciation for your work here ;) Always a small world.
Great work, Jeremy, both this project and your whole idea of this substack!! These curves remind me nostalgically of a sample of all ED visits (not just colds) I assembled from NCHS data in the early 2000s, and a throwaway hypothesis about flu vs RSV, made just to illustrate "hypothesis generation". Much sparser than the NREVSS, and utterly limited to symptoms, not diagnostic codes. Too sparse for age subgroups. I hope you're a little entertained by my editorial comments defending NHAMCS, the anti-billing codes organization.
Pitts SR. Ann EM 2013;62(5):540-542.