


Behind the scenes: Our new JAMA Pediatrics study on state firearm laws and pediatric mortality.
What we found, how we did it, and lessons learned.

Some professional news from my own work as a researcher in today’s newsletter. My colleagues and I have just published an original investigation in JAMA Pediatrics that I believe you’ll find important. As you can imagine, this work was time-intensive. It was also entirely unfunded. In a real sense, then, the research was made possible by two groups of people: Inside Medicine paid subscribers and the Yale Center for Outcomes Research and Evaluation, led by Dr. Harlan Krumholz. I’m grateful to you all. It may not be obvious, but your support of this newsletter supports my ability to fit extremely meaningful work like this into my life. I am so appreciative for that opportunity and hope you see the value in your contribution. Thanks so much. —Jeremy
Thousands of pediatric firearm deaths linked to more permissive state gun laws.
Minutes ago, my colleagues and I published original research in JAMA Pediatrics, the #1 pediatrics journal in the world, in which we report that the startling increase in firearm deaths in US children since 2010 is not evenly distributed across the 50 states. Not remotely. The study is entitled, “Firearm Laws and Pediatric Mortality in the US.”
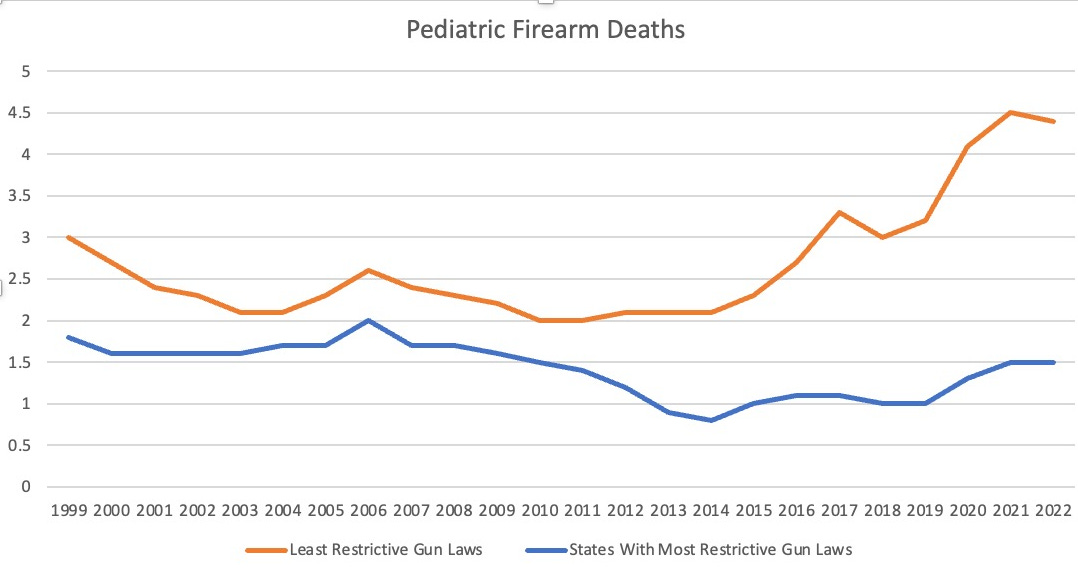
First, I’ll summarize our main findings. Some states started with higher pediatric firearm mortality rates than others, which was known. What’s new here is that groups of states that loosened gun laws since 2010 recorded over 7,400 more pediatric firearm deaths than would have been expected based on existing trends and population changes. That’s 19,251 recorded pediatric firearm deaths from 2011-2023 in the states that loosened laws, instead of 11,798 that our model projected, a 63% relative increase. Meanwhile, in states that enacted laws intended to enhance firearm safety, there was no change from rates predicted by our models. Our model predicted that during that period, in a group of states with stricter laws, there would be 4,267 pediatric firearm deaths. In reality, there turned out to be 4,212, just 55 fewer deaths than predicted, a decrease that was not statistically meaningful. That means our model was ~99% accurate over 13 years.
Intent: We found that deaths due to homicide and suicide increased.
Locale: In the states with the most permissive firearm laws, increases occurred in cities and rural areas alike.
Disparities: Firearm mortality was already highest among the non-Hispanic Black population by 2010. Recent rates in particular widened those disparities.
What inspired this work?
As a parent, I’ve often wondered whether our society is safer or less safe since my own childhood. Cars are safer, but firearm deaths have skyrocketed. I couldn’t remember the exact moment I started to think about this, but my phone’s text history with my friend, mentor, and frequent collaborator, Dr. Harlan Krumholz, held the answer. Apparently, I decided to look into this on December 28, 2023. I remember exactly where I was—an outdoor sofa in Nayarit, Mexico. This one, in fact…

I queried CDC data for pediatric firearm mortality in the northeast from the turn of the century to 2020. I was floored with what I saw: there was no increase! Next, I checked to see what was happening elsewhere. I chose to look at the south, where I suspected there would’ve been an increase. Indeed there had been increases there.

Right away, I ran what’s called a “sensitivity analysis.” I checked whether other causes of death had similar differences, northeast versus south. They didn’t.


Pediatric cancer mortality had decreased by about 25% and by over 50% for motor vehicle collisions in both areas of the country. Honestly, including the time spent making the graphs, this work took only me around 25 minutes.
But that was only the beginning. I knew that a geographic analysis was not going to cut it. I quickly assembled two groups of states, those with strict and permissive gun laws. (I used some online resources to make the groups).

I texted these over to Harlan and got the response I always hope for when I show him something new I’m exploring. “Wow,” he replied.
Of course, we both knew that these graphs weren’t remotely adequate for academic work in a top-tier journal. To properly conduct the research necessary to achieve that would take months of work, and a team of colleagues, ranging from data scientists to policy experts. Between that and other projects and obligations, it has been over a year and a half between the day I sent Harlan that text from Mexico and today, the day we finally published the fancy, statistically airtight version of this all in the most high-impact pediatrics journal in the known galaxy.
Here’s what the data look now like, complete with observed versus projected deaths, and 95% confidence intervals that are so narrow, you almost can’t see them.

What we did and how.
Academic papers really come down to good methods. Here’s what we did. We divided the states into three groups using a composite we developed to incorporate grading and scoring systems published by the Giffords Law Center, Everytown for Gun Safety, and the Brady Campaign. From there, we collected mortality data for before and after the landmark Supreme Court case McDonald v. Chicago (2010) to see if any statistical differences occurred.
Initially, we hoped to use a popular statistical tool called “difference in difference,” which compares the changes in two groups of states in order to factor out any changes that occurred in both places. The idea is that if mortality rates were increasing everywhere, but in some places more than others, you’d factor out the shared change. Here’s an example. State #1 enacts a new policy and State #2 does not. Let’s imagine State #1 had a trend that meant that over the next decade rates were expected to rise 10%. But in reality, rates rose 15%. In State #2, rates were expected to rise 10% but actually rose 12%. Both states exceeded projected rates, by 5% and 2% respectively. The difference in difference approach would say that, everything else equal, the increase attributable to the new law was only 3%, because we’d subtract the 2% rise that occurred in the state that didn’t make any policy change.
Difference in difference is all the rage in epidemiology research lately. The problem here was that unlike circumstances with a nice control (like State #2), it turns out that since McDonald, all states enacted new laws that either made it easier or harder to obtain and carry a firearm. That means a difference in difference approach would be nearly impossible to interpret.
So, we used a technique called Poisson regression to take the data from 1999-2010 and generate a slope that most closely aligned with every data point. We then extended that trend for 2011-2023, which effectively predicted “expected” deaths for that period.
Next, we accessed the actual deaths from 2011-2013 and subtracted the expected ones. That yields excess deaths—that is, the number of deaths above those we predicted. To give you a sense of how stable big data can be, keep in mind that the Poisson model predicted firearm mortality that was so accurate that it generated expected deaths just around 1% below what actually happened over 13 years. Not bad, eh?
What did we learn along the way?
A few other interesting tidbits to share. One thing that surprised me is the share of pediatric firearm deaths that were deemed to have been accidents. I would have thought that accidents were a big driver of these deaths. Turns out they are not. From 2018-2023, just 5% of pediatric firearm deaths were deemed accidents (60% were homicide, and 32% were suicide).
Doing this work also taught me about some of the laws (in both directions) states have enacted. While it’s not the purpose of the paper, we included an appendix that we are proud of which, to my knowledge, contains the best list of all the individual laws that each state has rolled out since 1999. If you open the appendix and peruse “eTable 2,” you’l see that until 2010, things were pretty quiet. But then after McDonald there was a flurry of activity. Between 1999-2010, Texas enacted one law making firearm access less restrictive (2007), and added eight such laws between 2011 and 2023. Meanwhile, from 1999-2010, California enacted three stricter laws, and enacted nine such laws from 2011-2023. Some of these laws are downright fascinating too, from requiring safety training on one side of the spectrum to allowing concealed carry in churches on the other.
Some states responded to tragedy. While Florida enacted six laws that made things less restrictive, it also passed the “Marjory Stoneman Douglas High School Public Safety Act,” which implemented several measures in response to the Parkland shooting including raising the minimum age to purchase firearms from 18 to 21, instituting a 3-day waiting period for firearm purchases, and banning bump stocks.
Connecticut is another important story. The Sandy Hook massacre of 2012 preceded any state law changes. Between 1999-2012, Connecticut made no legal changes around firearms. Since 2013, the state has enacted eight stricter laws (including some that do several things at once). It’s notable that Connecticut was one of two states in the strict firearm laws states that saw a statistical increase after the 2010 McDonald decision. However, if you exclude the Sandy Hook massacre, rates in the state remained unchanged.
I think people may ask why rates did not decrease in all places that enacted restrictions. I think the answer to that lies in the counterfactuals: the groups of states that increased access had worsening rates of child death due to guns. Most of the states that acted to make things safer resisted an otherwise upward trend.
Another important finding relates to disparities by race and ethnicity. We were only able to assess three large groups: non-Hispanic Black or African American, non-Hispanic White, and Hispanic. As above, existing disparities got magnified. But one interesting and important finding was that in the stricter law states, there was no increase in mortality rates among the Black or Hispanic children. (There was an 18% increase in mortality among White children, albeit the rates remained the lowest). It’s good to at least know that the laws may have been protective against increases, though it would have been nice to see more widespread decreases.
Some corrections, clarifications, and kudos…
During production of the final publication, I noticed a few typos and one mix-up, all of which were my fault. I alerted the editors, but they’d already sent the piece off to press. So, there will be some corrections issued which are minor but annoying to me personally. This is unusual for me. I am usually exceedingly careful—and in fact I was here too. I just didn’t do as close of a “numbers check” on every single figure in the paper as I normally do until too late in the process. When I did, I found these little bugaboos.
In the Abstract and Results sections, I wrote the units of the mortality rates incorrectly. The incident rates (IR), should be “per million population” not “per million person-years.” That was just a vestige from when we had not decided which unit to report. Also, in the beginning of the Discussion section, I wrote that the increases were more concentrated among homicides. That’s wrong. Both homicide and suicide death rates increased, but suicides increased a bit more than homicides. Homicides remain the majority of pediatric firearm deaths, but the share went down some.
These mistakes are not a big deal—and certainly they do not change the message or major interpretations of the study—but they are an important reminder to me and my colleagues that there are no shortcuts in life.
Finally, I’m sure people will poke all kinds of holes in this work. There are two I’d like to address up front. First, these are correlations, and correlation ≠ causation. However, I think the modeling and sensitivity analyses we did are pretty compelling. Second, people will ask why rates went up in a couple of strict states. One of them, Connecticut, is fairly easy to explain. The other, Illinois, is not. It’s worth saying that we don’t know what would have happened in any one state if the laws had not been enacted as they were. But overall, the conclusions from these trends are worth our attention.
It’s my hope that our leaders will notice this. I’m grateful to the office of Senator Elizabeth Warren—particularly Imani Franklin, Senior Counsel—for connecting me with important firearm safety advocates over the last couple of weeks to help disseminate this research. I’m also grateful to the various news outlets covering this work.
Finally, this work was a collaboration, with co-authors from Harvard, Yale, Brown, University of Pittsburgh, and UC San Francisco. Yale’s Dr. Ji Chen did outstanding statistical analysis on this, and Harvard undergraduate Shriya Bhat did great work assembling both the raw data and creating the tables in the appendix that have already become an important resource. My thanks also to my superb co-authors Dr. Onyekachi Otugo, Dr. Miranda Yaver, Benjamin Renton, Alexander Junxiang Chen, Dr. Zhenqiu Lin, and, of course, Dr. Harlan M. Krumholz. Without their efforts, this paper would still just be a few texts between Harlan and me.
I hope you’ll share this information widely. We don’t have all the answers. But without shining light on the truth, progress towards safer communities for our children will never be possible.
Resources/nonprofits. Volunteer or donate!
If you have information about any of the unfolding stories we are following, please email me or find me on Signal at InsideMedicine.88.
Just a superficial glance at the summary of this awesome study tells me (a retired bilingual "inner city" educator) that it should be unpacked and shared with educators-- so they can create lessons that show their students how the gun industry is directly affecting them.
Congratulations on an important and impressive study! My hope is that it will be shared and cited widely in order to nudge our lawmakers into action on this critical public & pediatric health issue.